 |
 |
|
|
 |
|
|
Tienda Online
|
|
|
|
Es seguro. Es Kalysis
|
|
|
|
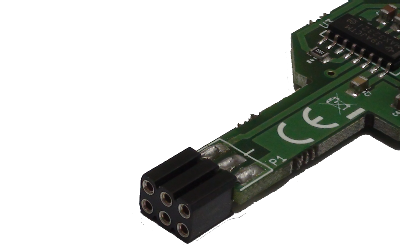
Kalysis Lectores Tarjetas Inteligentes
|
|
|
|
Idioma
|
  · Últimos 100 publicados · Últimos 100 publicados
· Archivo de Artículos
 Tendrá solo UNA Tendrá solo UNA
Sabía que...
... KALYSIS es portada del Nilson Report?

Issue 814, July 2004
... la patente 2.186.534 de Kalysis es la base de la aplicación del DNI Digital o de la firma electrónica en tarjeta inteligente?
 ... el "token USB" es un invento español patentado presentado publicamente en Bruselas? ... el "token USB" es un invento español patentado presentado publicamente en Bruselas?
...Los beneficios de pagos móviles crecerán drásticamente a USD20,000 millones en todo el mundo, de acuerdo con un nuevo informe estratégico de ARC Group. Esta cifra representa un crecimiento anual del 100%, y se deriva principalmente de nuevos tipos de transacción como prepago desde cajeros automáticos y otros innovadores ATMs. |
|
|
Empleo en Kalysis GRUPO
|
|
|
|
Tiendas Online & Pago Electrónico
|
|
|
|
Kalysis Community
|
|
|
|
Tarjetas Inteligentes Estadísticas
|
|
|
|
Kalysis GRUPO
|
 KALYSIS Iberia, SL KALYSIS Iberia, SL
Plaza de Uncibay 3
Primera Planta
29008 Málaga
ESPAÑA
952 60 81 93
686 500 726
CENTRO DE INVESTIGACIÓN
BIC Euronova - Centro Europeo de Empresas e Innovación (CEEI)
Parque Tecnológico de Andalucía (PTA)
Málaga, ES 29590
ESPAÑA
INTERNACIONAL Voz
+34 952 608193
ANID - National Association of Researchers in Educational Methodology
Camino de las Aguas, 48
37003 Salamanca
España
 KALYSIS, SA de CV KALYSIS, SA de CV
:: General Payment Services de México, SA de CV
Camino al Desierto de Los Leones Número 35
Colonia San Ángel Inn
01000 México, Distrito Federal

KALYSIS Central America
USA Office
9800 Southwest 62nd St
Miami, Florida 33173
USA
116 Northeast 3rd Avenue
Miami, Florida 33132
USA
+1 260 KALY-202
 KALYSIS Nicaragua, SA KALYSIS Nicaragua, SA
Edificio Grupo Lacayo
Km 5½ Carretera Norte Managua
NICARAGUA

KALYSIS Argentina
Buenos Aires
ARGENTINA

AVICARD Identificación
Avda. Gestido, M-26, S-17, Sangrila
Canelones
URUGUAY

KALYSIS Chile
Obispo Orrego, 42. Ñuñoa
Santiago de Chile
CHILE

KALYSIS Colombia SA
CRA 46 No 56-63
OFIC. 109
Edificio Argental
Medellín
COLOMBIA
INTERNACIONAL Voz
+34 952 608193

Distribuidores EMEA
Austria, Alemania, Suiza, Dinamarca, Suecia, Noruega, Finlandia, Polonia, República Checa, Eslovaquia, Hungría, Eslovenia, Croacia, Latvia, Estonia y LituaniaRelaciones con la prensa y medios de comunicación
Iraís Quintana:

Sindicar Artículos de Kalysis Community
Tarjetas Inteligentes  |
|
|
|
Estadísticas sobre Tarjetas Inteligentes
|
Statistics for Smart Cards
Although Asia's
card market still lacks multi-application cards, great potential
exists for specialized applications. Over time, smart cards will
be most used with set-top boxes and mobile phones and not PCs as
originally envisioned.
Global Smart
Card Market By Industry, 2001 - 2003
| Market (millions of
units) |
2001 |
2002 |
2003 |
Growth Forecast
2003 vs 2002 |
| |
| Mobile Comms |
400 |
450 |
550 |
22% |
| |
| Banking |
145 |
181 |
220 |
22% |
| |
| eGov, IT, PayTV &
transit |
196 |
263 |
357 |
36% |
| |
| By Region |
|
|
|
Share of Total |
| |
| EMEA |
883 |
923 |
974 |
46% |
| |
| Asia-Pacific |
558 |
597 |
656 |
31% |
| |
| Latin America |
322 |
346 |
402 |
19% |
| |
| North America |
38 |
58 |
85 |
4% |
Source: SchlumbergerSema, March 2002
Regional
Breakdown of Financial Smart Cards, 1999 - 2004
| Year |
1999 |
2000 |
2001 |
2002 |
2003 |
2004 |
| |
| Asia-Pacific % |
6.61 |
7.78 |
12.63 |
21.85 |
26.46 |
25.17 |
| |
| European Union % |
90.82 |
84.09 |
73.92 |
59.85 |
49.49 |
43.82 |
| |
| North America % |
0.37 |
4.59 |
8.31 |
11.79 |
14.64 |
19.5 |
| |
| Latin America % |
1.84 |
2.69 |
3.67 |
4.79 |
7.79 |
9.81 |
| |
| Rest of World % |
0.37 |
0.85 |
1.47 |
1.72 |
1.65 |
1.70 |
Source: Frost & Sullivan, using 2000 as base
year

Financial
Smart Cards In The Asia-Pacific, 1999 - 2004
| Year |
Units (million) |
| |
| 1999 |
5 |
| |
| 2000 |
8 |
| |
| 2001 |
11 |
| |
| 2002 |
41 |
| |
| 2003 |
67 |
| |
| 2004 |
79 |
Source: Frost & Sullivan, using 2000 as base
year
Bank Smart
Card Percentages By World Region, 2001
| Region |
Percentage |
| |
| Europe |
84% |
| |
| Other |
6% |
| |
| Asia-Pacific |
5% |
| |
| USA |
5% |
| |
| Total
number of bank smart cards: 233 million |
| |
Source: Celent Communications , November 2001
Scope
for Smart Cards Within eCommerce (in millions)
| Year |
PC |
Set-Top Box |
Mobile Phone |
| |
| 1998 |
- |
3,016 |
- |
| |
| 1999 |
108 |
5,628 |
636 |
| |
| 2000 |
471 |
8,700 |
4,044 |
| |
| 2001 |
1,056 |
11,815 |
10,435 |
| |
| 2002 |
1,891 |
15,031 |
19,877 |
| |
| 2003 |
3,287 |
18,662 |
32,344 |
Source: Datamonitor
Number of
Card-Based e-Money Products in Brazil, 1999
| Name of System |
Type |
No of Cards Issued/
No of Home PC users |
Volume of Daily
Payments |
Volume of Daily
Purchases |
Average Value of
Payments |
| |
| Visa Cash |
Card |
95,000 |
334 |
$1,477 |
$4.42 |
| |
| SIBS |
Card |
40,100 |
960 |
$3,073 |
$3.20 |
Source: eMarketer
Number
of Smart Cards Issued in Asia
| Country |
Number |
|
Primary Uses |
| |
| Australia |
10 million |
|
Phone, POS, ticketing |
| |
| Cambodia |
8.5 million |
|
National ID |
| |
| China |
3 million |
|
eCash, utilities, tolls |
| |
| Hong Kong |
5 million |
|
Transit, eCash, parking |
| |
| Malaysia |
2 million |
|
eCash, ID, tolls |
| |
| Philippines |
35 million |
|
Social security |
| |
| Singapore |
0.7 million |
|
Tolls, transit, eCash, |
| |
| South Korea |
9 million |
|
Transit, eCash |
| |
| Taiwan |
n/a |
|
Transit, eCash |
| |
| Thailand |
n/a |
|
eCash, loyalty |
| |
| Number of smart cards
in Asia: 70 million |
Projected
card statistics for 2002:
- Asian
share of global sales = 30.1%
- Value of
global market: USD 6.8 per annum
- Global
CAG: 37.8%
Source: International Data Corporation (May 07 1999)
|
|
|
|
|
|
|
Kalysis GRUPO © 2001-2021 Licensed Materials - Program Property of Kalysis. All Rights Reserved
Licensed under one or more Spain Patents Nº 2,186,534 assigned to Kalysis Iberia, SL. MEI® is a trademark of Kalysis GRUPO
All trademarks are the property of their respective companies. Technical data subject to change without notice

El Greco, 17. 29749 Málaga - Andalucía - España - EU ☎ (+34) 952 60.81.93 ☎ (+34) 952 22.79.60 ☎ (+34) 686-500-726
Inscrita en el Registro Mercantil nº 5 de Málaga. Tomo 3.322, Libro 2.234, Folio 45, Hoja MA-63694. Sociedad Limitada C.I.F. ES B92451996 Kalysis es un Operador Intracomunitario registrado en el V.I.E.S.
© 2001-2021 Kalysis Iberia, SL
|
|


 Tarjetas Inteligentes en Europa